
analyzers.lib
Analyzers library. Its official prefix is an.
This library provides reusable building blocks for audio signal analysis and metering. It includes functions and components for measuring levels, extracting features, and computing statistics useful in visualization, diagnostics, adaptive processing, and music information retrieval.
The Analyzers library is organized into 11 sections:
- Amplitude Tracking
- Adaptive Frequency Analysis
- Spectrum-Analyzers
- Mth-Octave Spectral Level
- Arbitrary-Crossover Filter-Banks and Spectrum Analyzers
- Fast Fourier Transform (fft) and its Inverse (ifft)
- Window Functions
- FFT Subsystem
- Spectral Descriptors (filter-bank based)
- Loudness Metering (EBU R128 / ITU-R BS.1770)
- Test signal generators
References
Amplitude Tracking
(an.)abs_envelope_rect
Absolute value average with moving-average algorithm.
Usage
_ : abs_envelope_rect(period) : _
Where:
period: sets the averaging frame in seconds
Test
an = library("analyzers.lib");
os = library("oscillators.lib");
mono = os.tosc(220);
abs_envelope_rect_test = an.abs_envelope_rect(0.05, mono);
(an.)abs_envelope_tau
Absolute value average with one-pole lowpass and tau response (see filters.lib).
Usage
_ : abs_envelope_tau(period) : _
Where:
period: (time to decay by 1/e) sets the averaging frame in secs
Test
an = library("analyzers.lib");
os = library("oscillators.lib");
mono = os.tosc(220);
abs_envelope_tau_test = an.abs_envelope_tau(0.05, mono);
(an.)abs_envelope_t60
Absolute value average with one-pole lowpass and t60 response (see filters.lib).
Usage
_ : abs_envelope_t60(period) : _
Where:
period: (time to decay by 60 dB) sets the averaging frame in secs
Test
an = library("analyzers.lib");
os = library("oscillators.lib");
mono = os.tosc(220);
abs_envelope_t60_test = an.abs_envelope_t60(0.05, mono);
(an.)abs_envelope_t19
Absolute value average with one-pole lowpass and t19 response (see filters.lib).
Usage
_ : abs_envelope_t19(period) : _
Where:
period: (time to decay by 1/e^2.2) sets the averaging frame in secs
Test
an = library("analyzers.lib");
os = library("oscillators.lib");
mono = os.tosc(220);
abs_envelope_t19_test = an.abs_envelope_t19(0.05, mono);
(an.)amp_follower, (an.)peak_envelope
Classic analog audio envelope follower with infinitely fast rise and exponential decay. The amplitude envelope instantaneously follows the absolute value going up, but then floats down exponentially.
amp_follower is a standard Faust function.
Usage
_ : amp_follower(rel) : _
_ : peak_envelope(rel) : _
Where:
rel: release time = amplitude-envelope time-constant (sec) going down
peak_envelope is a synonym of amp_follower, for more standard naming.
Test
an = library("analyzers.lib");
os = library("oscillators.lib");
ba = library("basics.lib");
ma = library("maths.lib");
no = library("noises.lib");
mono = os.tosc(220);
amp_follower_test = mono : an.amp_follower(0.05);
amp_follower_slider_test = no.noise*pow(0.001, float(ba.period(Q))/Q) : an.amp_follower(hslider("amp_follower:rel", 0.05, 0.001, 1, 0.001)) with { Q = int(ma.SR/4); };
amp_follower_modulated_test = no.noise*pow(0.001, float(ba.period(Q))/Q) : an.amp_follower(0.001*pow(1000, tri)) with { Q = int(ma.SR/4); P = int(ma.SR/10); tri = 1 - abs(2*ba.period(P)/P - 1); };
amp_follower_jump_test = no.noise*pow(0.001, float(ba.period(Q))/Q) : an.amp_follower(0.001*pow(1000, sq)) with { Q = int(ma.SR/4); P = int(ma.SR/10); sq = ba.period(2*P) < P; };
References
- Musical Engineer's Handbook, Bernie Hutchins, Ithaca NY
- 1975 Electronotes Newsletter, Bernie Hutchins
(an.)amp_follower_ud
Envelope follower with different up and down time-constants (also called a "peak detector").
Usage
_ : amp_follower_ud(att,rel) : _
Where:
att: attack time = amplitude-envelope time constant (sec) going uprel: release time = amplitude-envelope time constant (sec) going down
Test
an = library("analyzers.lib");
os = library("oscillators.lib");
ba = library("basics.lib");
ma = library("maths.lib");
no = library("noises.lib");
mono = os.tosc(220);
amp_follower_ud_test = mono : an.amp_follower_ud(0.002, 0.05);
amp_follower_ud_slider_test = no.noise*pow(0.001, float(ba.period(Q))/Q) : an.amp_follower_ud(hslider("amp_follower_ud:att", 0.002, 0.0001, 0.01, 0.0001), hslider("amp_follower_ud:rel", 0.05, 0.01, 1, 0.001)) with { Q = int(ma.SR/4); };
amp_follower_ud_modulated_test = no.noise*pow(0.001, float(ba.period(Q))/Q) : an.amp_follower_ud(0.0005*pow(20, tri), 0.05) with { Q = int(ma.SR/4); P = int(ma.SR/10); tri = 1 - abs(2*ba.period(P)/P - 1); };
amp_follower_ud_jump_test = no.noise*pow(0.001, float(ba.period(Q))/Q) : an.amp_follower_ud(0.0005*pow(20, sq), 0.05) with { Q = int(ma.SR/4); P = int(ma.SR/10); sq = ba.period(2*P) < P; };
Note
We assume rel >> att. Otherwise, consider rel ~ max(rel,att).
For audio, att is normally faster (smaller) than rel (e.g., 0.001 and 0.01).
Use amp_follower_ar below to remove this restriction.
References
- "Digital Dynamic Range Compressor Design --- A Tutorial and Analysis", by Dimitrios Giannoulis, Michael Massberg, and Joshua D. Reiss https://www.eecs.qmul.ac.uk/~josh/documents/2012/GiannoulisMassbergReiss-dynamicrangecompression-JAES2012.pdf
(an.)amp_follower_ar
Envelope follower with independent attack and release times. The
release can be shorter than the attack (unlike in amp_follower_ud
above).
Usage
_ : amp_follower_ar(att,rel) : _
Where:
att: attack time = amplitude-envelope time constant (sec) going uprel: release time = amplitude-envelope time constant (sec) going down
Test
an = library("analyzers.lib");
os = library("oscillators.lib");
mono = os.tosc(220);
amp_follower_ar_test = mono : an.amp_follower_ar(0.002, 0.05);
(an.)ms_envelope_rect
Mean square with moving-average algorithm.
Usage
_ : ms_envelope_rect(period) : _
Where:
period: sets the averaging frame in secs
Test
an = library("analyzers.lib");
os = library("oscillators.lib");
mono = os.tosc(220);
ms_envelope_rect_test = an.ms_envelope_rect(0.05, mono);
(an.)ms_envelope_tau
Mean square average with one-pole lowpass and tau response (see filters.lib).
Usage
_ : ms_envelope_tau(period) : _
Where:
period: (time to decay by 1/e) sets the averaging frame in secs
Test
an = library("analyzers.lib");
os = library("oscillators.lib");
mono = os.tosc(220);
ms_envelope_tau_test = an.ms_envelope_tau(0.05, mono);
(an.)ms_envelope_t60
Mean square with one-pole lowpass and t60 response (see filters.lib).
Usage
_ : ms_envelope_t60(period) : _
Where:
period: (time to decay by 60 dB) sets the averaging frame in secs
Test
an = library("analyzers.lib");
os = library("oscillators.lib");
mono = os.tosc(220);
ms_envelope_t60_test = an.ms_envelope_t60(0.05, mono);
(an.)ms_envelope_t19
Mean square with one-pole lowpass and t19 response (see filters.lib).
Usage
_ : ms_envelope_t19(period) : _
Where:
period: (time to decay by 1/e^2.2) sets the averaging frame in secs
Test
an = library("analyzers.lib");
os = library("oscillators.lib");
mono = os.tosc(220);
ms_envelope_t19_test = an.ms_envelope_t19(0.05, mono);
(an.)rms_envelope_rect
Root mean square with moving-average algorithm.
Usage
_ : rms_envelope_rect(period) : _
Where:
period: sets the averaging frame in secs
Test
an = library("analyzers.lib");
os = library("oscillators.lib");
mono = os.tosc(220);
rms_envelope_rect_test = an.rms_envelope_rect(0.05, mono);
(an.)rms_envelope_tau
Root mean square with one-pole lowpass and tau response (see filters.lib).
Usage
_ : rms_envelope_tau(period) : _
Where:
period: (time to decay by 1/e) sets the averaging frame in secs
Test
an = library("analyzers.lib");
os = library("oscillators.lib");
mono = os.tosc(220);
rms_envelope_tau_test = an.rms_envelope_tau(0.05, mono);
(an.)rms_envelope_t60
Root mean square with one-pole lowpass and t60 response (see filters.lib).
Usage
_ : rms_envelope_t60(period) : _
Where:
period: (time to decay by 60 dB) sets the averaging frame in secs
Test
an = library("analyzers.lib");
os = library("oscillators.lib");
mono = os.tosc(220);
rms_envelope_t60_test = an.rms_envelope_t60(0.05, mono);
(an.)rms_envelope_t19
Root mean square with one-pole lowpass and t19 response (see filters.lib).
Usage
_ : rms_envelope_t19(period) : _
Where:
period: (time to decay by 1/e^2.2) sets the averaging frame in secs
Test
an = library("analyzers.lib");
os = library("oscillators.lib");
mono = os.tosc(220);
rms_envelope_t19_test = an.rms_envelope_t19(0.05, mono);
(an.)zcr
Zero-crossing rate (ZCR) with one-pole lowpass averaging based on the tau constant. It outputs an index between 0 and 1 at a desired analysis frame. The ZCR of a signal correlates with the noisiness [Gouyon et al. 2000] and the spectral centroid [Herrera-Boyer et al. 2006] of a signal. For sinusoidal signals, the ZCR can be multiplied by ma.SR/2 and used as a frequency detector. For example, it can be deployed as a computationally efficient adaptive mechanism for automatic Larsen suppression.
Usage
_ : zcr(tau) : _
Where:
tau: (time to decay by e^-1) sets the averaging frame in seconds.
Test
an = library("analyzers.lib");
os = library("oscillators.lib");
mono = os.tosc(220);
zcr_test = an.zcr(0.01, mono);
Adaptive Frequency Analysis
(an.)pitchTracker
This function implements a pitch-tracking algorithm by means of zero-crossing rate analysis and adaptive low-pass filtering. The design is based on the algorithm described in this tutorial (section 2.2).
Usage
_ : pitchTracker(N, tau) : _
Where:
N: a constant numerical expression, sets the order of the low-pass filter, which determines the sensitivity of the algorithm for signals where partials are stronger than the fundamental frequency.tau: response time in seconds based on exponentially-weighted averaging with tau time-constant. See https://ccrma.stanford.edu/~jos/st/Exponentials.html.
The estimate fed back to the low-pass cutoff is smoothed by si.smoo: an
abrupt cutoff change makes the filter ring near its (low) cutoff, and those
zero crossings could otherwise hold the estimate there.
Test
an = library("analyzers.lib");
os = library("oscillators.lib");
mono = os.tosc(220);
pitchTracker_test = an.pitchTracker(4, 0.02, mono);
pitchTracker_slider_test = an.pitchTracker(4, hslider("pitchTracker:tau", 0.02, 0.001, 1, 0.001), os.tosc(220));
(an.)spectralCentroid
This function implements a time-domain spectral centroid by means of RMS measurements and adaptive crossover filtering. The weight difference of the upper and lower spectral powers are used to recursively adjust the crossover cutoff so that the system (minimally) oscillates around a balancing point.
Unlike block processing techniques such as FFT, this algorithm provides continuous measurements and fast response times. Furthermore, when providing input signals that are spectrally sparse, the algorithm will output a logarithmic measure of the centroid, which is perceptually desirable for musical applications. For example, if the input signal is the combination of three tones at 1000, 2000, and 4000 Hz, the centroid will be the middle octave.
Usage
_ : spectralCentroid(nonlinearity, tau) : _
Where:
nonlinearity: a boolean to activate or deactivate nonlinear integration. The nonlinear function is useful to improve stability with very short response times such as .001 <= tau <= .005 , otherwise, the nonlinearity may reduce precision.tau: response time in seconds based on exponentially-weighted averaging with tau time-constant. See https://ccrma.stanford.edu/~jos/st/Exponentials.html.
Example:
process = os.osc(500) + os.osc(1000) + os.osc(2000) + os.osc(4000) + os.osc(8000) : an.spectralCentroid(1, .001);
Test
an = library("analyzers.lib");
os = library("oscillators.lib");
rich = os.tosc(440) + os.tosc(880);
spectralCentroid_test = rich : an.spectralCentroid(1, 0.01);
spectralCentroid_slider_test = os.tosc(440) + os.tosc(880) : an.spectralCentroid(1, hslider("spectralCentroid:tau", 0.01, 0.001, 1, 0.001));
References
Sanfilippo, D. (2021). Time-Domain Adaptive Algorithms for Low- and High-Level Audio Information Processing. Computer Music Journal, 45(1), 24-38.
Spectrum-Analyzers
Spectrum-analyzers split the input signal into a bank of parallel signals, one for
each spectral band. They are related to the Mth-Octave Filter-Banks in filters.lib.
The documentation of this library contains more details about the implementation.
The parameters are:
M: number of band-slices per octave (>=1)N: total number of bands (>2)ftop= upper bandlimit of the Mth-octave bands (<SR/2)
In addition to the Mth-octave output signals, there is a highpass signal containing frequencies from ftop to SR/2, and a "dc band" lowpass signal containing frequencies from 0 (dc) up to the start of the Mth-octave bands. Thus, the N output signals are:
highpass(ftop), MthOctaveBands(M,N-2,ftop), dcBand(ftop*2^(-(N-2)/M))
A Spectrum-Analyzer is defined here as any band-split whose bands span the relevant spectrum, but whose band-signals do not necessarily sum to the original signal, either exactly or to within an allpass filtering. Spectrum analyzer outputs are normally at least nearly "power complementary", i.e., the power spectra of the individual bands sum to the original power spectrum (to within some negligible tolerance).
Increasing Channel Isolation
Go to higher filter orders - see Regalia et al. or Vaidyanathan (cited below) regarding the construction of more aggressive recursive filter-banks using elliptic or Chebyshev prototype filters.
References
- "Tree-structured complementary filter banks using all-pass sections", Regalia et al., IEEE Trans. Circuits & Systems, CAS-34:1470-1484, Dec. 1987
- "Multirate Systems and Filter Banks", P. Vaidyanathan, Prentice-Hall, 1993
- Elementary filter theory: https://ccrma.stanford.edu/~jos/filters/
(an.)mth_octave_analyzer, (an.)mth_octave_analyzer3, (an.)mth_octave_analyzer5, (an.)mth_octave_analyzer6e, (an.)mth_octave_analyzer_default
Octave analyzer.
mth_octave_analyzer[N] are standard Faust functions.
Splits whose crossover is at or above fi.tpt_df_fmin (2304 Hz in single
precision, 0 in double) are direct form, the others trapezoidal: see
mth_octave_analyzer_tpt_df.
Usage
_ : mth_octave_analyzer(O,M,ftop,N) : par(i,N,_) // Oth-order Butterworth
_ : mth_octave_analyzer6e(M,ftop,N) : par(i,N,_) // 6th-order elliptic
Also for convenience:
_ : mth_octave_analyzer3(M,ftop,N) : par(i,N,_) // 3d-order Butterworth
_ : mth_octave_analyzer5(M,ftop,N) : par(i,N,_) // 5th-order Butterworth
_ : mth_octave_analyzer_default(M,ftop,N) : par(i,N,_) // = mth_octave_analyzer6e
Where:
O: (odd) order of filter used to split each frequency band into twoM: number of band-slices per octaveftop: highest band-split crossover frequency (e.g., 20 kHz)N: total number of bands (including dc and Nyquist)
Test
an = library("analyzers.lib");
os = library("oscillators.lib");
mono = os.tosc(220);
mth_octave_analyzer_test = mono : an.mth_octave_analyzer(3, 3, 8000, 5);
(an.)mth_octave_analyzer_tpt_df, (an.)mth_octave_analyzer6e_tpt_df
mth_octave_analyzer and mth_octave_analyzer6e with an explicit cutoff
limit L: the band splits whose crossover is below L use trapezoidal
sections, the others the cheaper direct-form sections
(fi.lowpass_tpt_df, fi.lowpass6e_tpt_df). The analyzers above are
these with L = fi.tpt_df_fmin: trapezoidal below 2304 Hz in single
precision, direct form everywhere in double precision. Each split is
compiled in one form only when its crossover is a constant; for a varying
ftop, pass L = ma.MAX (trapezoidal) or L = 0 (direct form), or both
forms run.
Usage
_ : mth_octave_analyzer_tpt_df(L,O,M,ftop,N) : par(i,N,_)
_ : mth_octave_analyzer6e_tpt_df(L,M,ftop,N) : par(i,N,_)
Where:
L: cutoff limit in Hz, usuallyfi.tpt_df_fmin;L <= 0selects the direct form andL >= ma.MAXthe trapezoidal form for every crossoverO,M,ftop,N: as formth_octave_analyzer
Test
an = library("analyzers.lib");
fi = library("filters.lib");
no = library("noises.lib");
mth_octave_analyzer_tpt_df_test = no.noise : an.mth_octave_analyzer_tpt_df(fi.tpt_df_fmin, 5, 2, 10000, 12);
mth_octave_analyzer6e_tpt_df_test = no.noise : an.mth_octave_analyzer6e_tpt_df(fi.tpt_df_fmin, 2, 10000, 12);
Mth-Octave Spectral Level
Spectral Level: display (in bargraphs) the average signal level in each spectral band.
(an.)mth_octave_spectral_level6e, (an.)mth_octave_spectral_level_default, (an.)spectral_level
Spectral level display. spectral_level is
mth_octave_spectral_level_default(2,10000,20): half-octave bands, the
top one at 10 kHz, 20 bands in all.
Usage
_ : mth_octave_spectral_level6e(M,ftop,NBands,tau,dB_offset) : _
_ : mth_octave_spectral_level_default(M,ftop,NBands,tau,dB_offset) : _
_ : spectral_level(tau,dB_offset) : _
Where:
M: bands per octaveftop: lower edge frequency of top bandNBands: number of passbands (including highpass and dc bands),tau: spectral display averaging-time (time constant) in seconds,dB_offset: constant dB offset in all band level meters.
Also for convenience:
mth_octave_spectral_level_default = mth_octave_spectral_level6e;
spectral_level = mth_octave_spectral_level_default(2,10000,20);
Test
an = library("analyzers.lib");
os = library("oscillators.lib");
mono = os.tosc(220);
mth_octave_spectral_level6e_test = mono : an.mth_octave_spectral_level6e(3, 8000, 5, 0.05, 0);
spectral_level_test = os.tosc(220) : an.spectral_level(0.05, 0);
(an.)octave_analyzer, (an.)half_octave_analyzer, (an.)third_octave_analyzer, (an.)octave_filterbank, (an.)half_octave_filterbank, (an.)third_octave_filterbank
A bunch of special cases based on the different analyzer functions described above:
third_octave_analyzer(N) = mth_octave_analyzer_default(3,10000,N);
third_octave_filterbank(N) = fi.mth_octave_filterbank_default(3,10000,N);
half_octave_analyzer(N) = mth_octave_analyzer_default(2,10000,N);
half_octave_filterbank(N) = fi.mth_octave_filterbank_default(2,10000,N);
octave_filterbank(N) = fi.mth_octave_filterbank_default(1,10000,N);
octave_analyzer(N) = mth_octave_analyzer_default(1,10000,N);
Usage
_ : octave_analyzer(N) : par(i,N,_)
_ : half_octave_analyzer(N) : par(i,N,_)
_ : third_octave_analyzer(N) : par(i,N,_)
_ : octave_filterbank(N) : par(i,N,_)
_ : half_octave_filterbank(N) : par(i,N,_)
_ : third_octave_filterbank(N) : par(i,N,_)
Where:
N: total number of bands (including dc and Nyquist)
See mth_octave_spectral_level_demo in demos.lib for an example.
Test
an = library("analyzers.lib");
os = library("oscillators.lib");
octave_filterbank_test = os.tosc(440) : an.octave_filterbank(5);
half_octave_filterbank_test = os.tosc(440) : an.half_octave_filterbank(6);
third_octave_filterbank_test = os.tosc(440) : an.third_octave_filterbank(8);
Arbitrary-Crossover Filter-Banks and Spectrum Analyzers
These are similar to the Mth-octave analyzers above, except that the band-split frequencies are passed explicitly as arguments.
(an.)analyzer
Analyzer.
Splits whose crossover is at or above fi.tpt_df_fmin (2304 Hz in single
precision, 0 in double) are direct form, the others trapezoidal: see
analyzer_tpt_df.
Usage
_ : analyzer(O,freqs) : par(i,ba.count(freqs)+1,_) // No delay equalizer
Where:
O: band-split filter order (ODD integer required for filterbank[i])freqs: (fc1,fc2,...,fcNs) [in numerically ascending order], where Ns=N-1 is the number of octave band-splits (total number of bands N=Ns+1, the number of outputs).
If frequencies are listed explicitly as arguments, enclose them in parens:
_ : analyzer(3,(fc1,fc2)) : _,_,_
Test
an = library("analyzers.lib");
os = library("oscillators.lib");
mono = os.tosc(220);
analyzer_test = mono : an.analyzer(3, (500, 2000));
(an.)analyzer_tpt_df
analyzer with an explicit cutoff limit L, as
mth_octave_analyzer_tpt_df is to mth_octave_analyzer:
analyzer(O,freqs) is analyzer_tpt_df(fi.tpt_df_fmin,O,freqs). For
crossovers that vary (sliders), pass L = ma.MAX (trapezoidal) or
L = 0 (direct form), or both forms run.
Usage
_ : analyzer_tpt_df(L,O,freqs) : par(i,ba.count(freqs)+1,_)
Where:
L: cutoff limit in Hz, usuallyfi.tpt_df_fmin;L <= 0selects the direct form andL >= ma.MAXthe trapezoidal form for every crossoverO,freqs: as foranalyzer
Test
an = library("analyzers.lib");
fi = library("filters.lib");
no = library("noises.lib");
ba = library("basics.lib");
ma = library("maths.lib");
analyzer_tpt_df_test = no.noise : an.analyzer_tpt_df(fi.tpt_df_fmin, 3, (50, 500, 4000));
analyzer_tpt_df_slider_test = no.noise : an.analyzer_tpt_df(fi.tpt_df_fmin, 3, (hslider("f1", 500, 20, 10000, 1), hslider("f2", 4000, 20, 20000, 1)));
analyzer_tpt_df_modulated_test = no.noise : an.analyzer_tpt_df(0, 3, (f1, 4*f1)) with { P = int(ma.SR/10); tri = 1 - abs(2*ba.period(P)/P - 1); f1 = 2500*pow(2, tri); };
analyzer_tpt_df_jump_test = no.noise : an.analyzer_tpt_df(ma.MAX, 3, (f1, 4*f1)) with { P = int(ma.SR/10); sq = ba.period(2*P) < P; f1 = 100*pow(10, sq); };
Fast Fourier Transform (fft) and its Inverse (ifft)
Sliding FFTs that compute a rectangularly windowed FFT each sample.
(an.)goertzelOpt
Optimized Goertzel filter.
Usage
_ : goertzelOpt(freq,n) : _
Where:
freq: frequency to be analyzed (rounded to the nearest DFT bin,freq*n/SR)n: the Goertzel block size
Test
an = library("analyzers.lib");
os = library("oscillators.lib");
goertzelOpt_test = an.goertzelOpt(440, 128, os.tosc(440));
References
(an.)goertzelComp
Complex Goertzel filter.
Usage
_ : goertzelComp(freq,n) : _
Where:
freq: frequency to be analyzed (rounded to the nearest DFT bin,freq*n/SR)n: the Goertzel block size
Test
an = library("analyzers.lib");
os = library("oscillators.lib");
goertzelComp_test = an.goertzelComp(440, 128, os.tosc(440));
References
(an.)goertzel
Same as goertzelOpt.
Usage
_ : goertzel(freq,n) : _
Where:
freq: frequency to be analyzedn: the Goertzel block size
Test
an = library("analyzers.lib");
os = library("oscillators.lib");
goertzel_test = an.goertzel(440, 128, os.tosc(440));
References
(an.)resonator
Efficient low-latency single-frequency resonator. It estimates
the magnitude and phase of a single target frequency f
in real time, with minimal memory and CPU usage, without the need for
FFT or windowing.
Usage
_ : resonator(N,f) : _,_ // magnitude, phase
Where:
N: smoothing filter order (compile-time constant).- N > 1: smoother magnitude/phase estimates, but slower response at low f
- N = 1: faster response at low f, less stable at any f
f: frequency to be analyzed (Hz).
Test
an = library("analyzers.lib");
os = library("oscillators.lib");
ba = library("basics.lib");
ma = library("maths.lib");
no = library("noises.lib");
mono = os.tosc(220);
resonator_test = mono : an.resonator(2, 440);
resonator_slider_test = os.tosc(220) : an.resonator(2, hslider("resonator:f", 440, 20, 5000, 1)) : _, !;
resonator_modulated_test = no.noise : an.resonator(2, 20*pow(250, tri)) : _, ! with { P = int(ma.SR/10); tri = 1 - abs(2*ba.period(P)/P - 1); };
resonator_jump_test = no.noise : an.resonator(2, 20*pow(250, sq)) : _, ! with { P = int(ma.SR/10); sq = ba.period(2*P) < P; };
Algorithm
Internally, the resonator maintains a quadrature oscillator at f
and accumulates the projection of the input signal onto its sine and
cosine components. These projections are smoothed using an exponential
moving average (EWMA) whose decay factor depends on f:
sf(f) = 1 − exp(−f / (log(1+f) * SR))
Magnitude and phase are then computed from the smoothed projections:
magnitude = sqrt(so² + co²) * 2
phase     = atan2(so, co)
Example
F = nentry("F", 1000, 0, 10000, 0.001);
process = ba.line(ma.SR, ma.SR/2) : os.oscrs
         <: par(i, 4, resonator(i+1, F) : _,!);
Advantages
- Ultra-low latency: single-sample recursive update
- No FFT or windowing required
- Frequency-dependent smoothing for better stability at low f
- Scales linearly with the number of resonators
References
Window Functions
Continuous window functions, defined on the normalized abscissa x in [0,1] and evaluating to their peak at x = 1/2. Each is a pure arithmetic expression, so it can be applied to a constant (to weight the taps of an FIR or the grains of a granular engine at compile time) as well as to a signal (a phase ramp, for run-time windowing):
// N compile-time weights (symmetric window):
w(i) = an.window_hann(i/(N-1));
// run-time windowing of a stream, with ph a 0..1 phase ramp:
process = _ * an.window_hann(ph);
For DFT-even (periodic) windows, evaluate at i/N instead of i/(N-1).
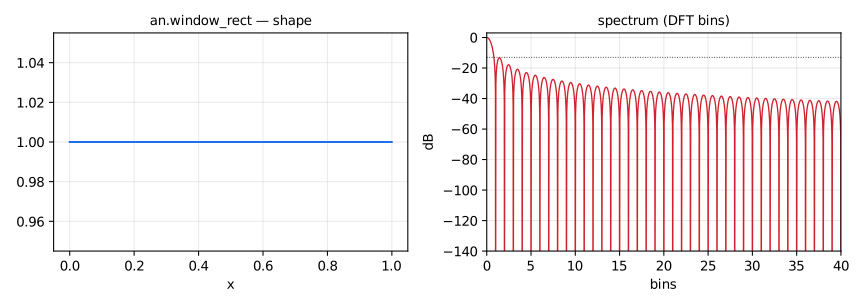
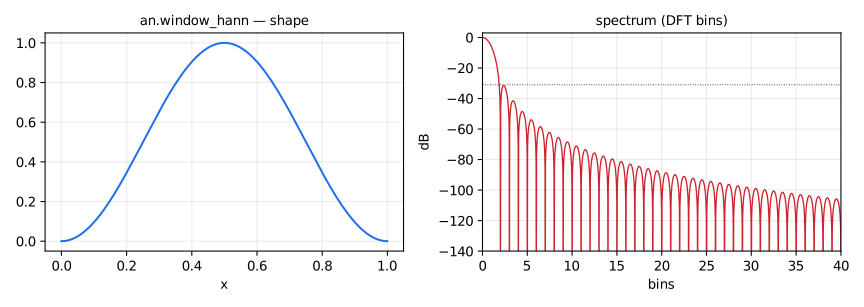
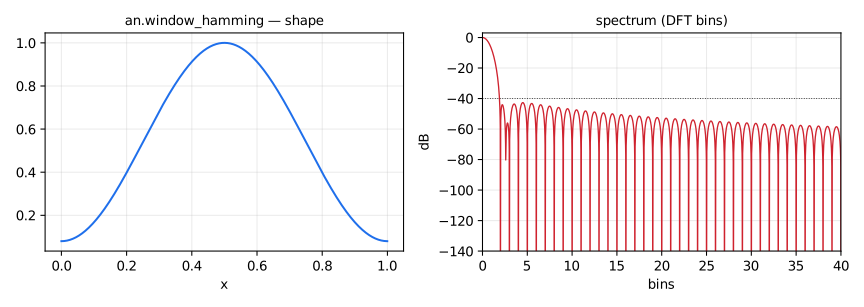
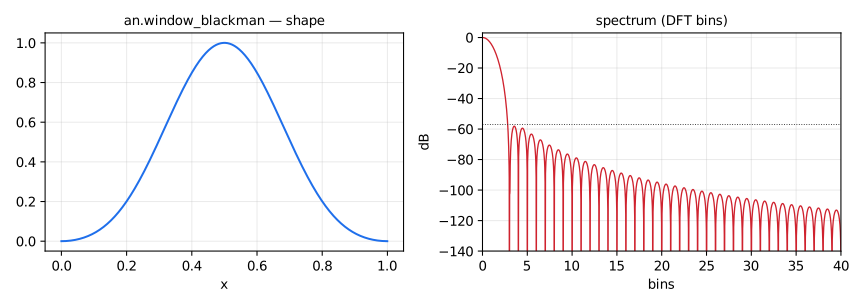
(an.)window_rect, (an.)window_hann, (an.)window_hamming, (an.)window_blackman, (an.)window_blackman_harris, (an.)window_nuttall, (an.)window_flattop, (an.)window_bartlett
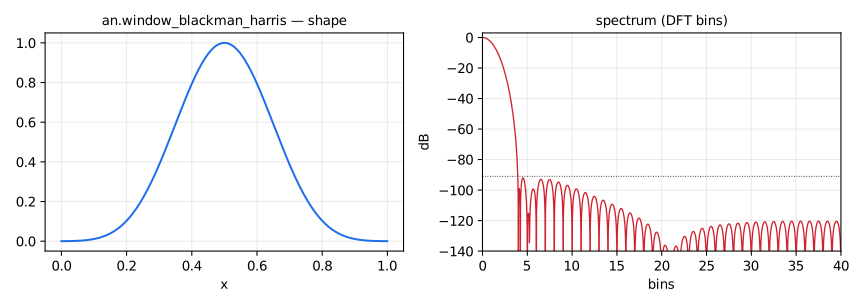
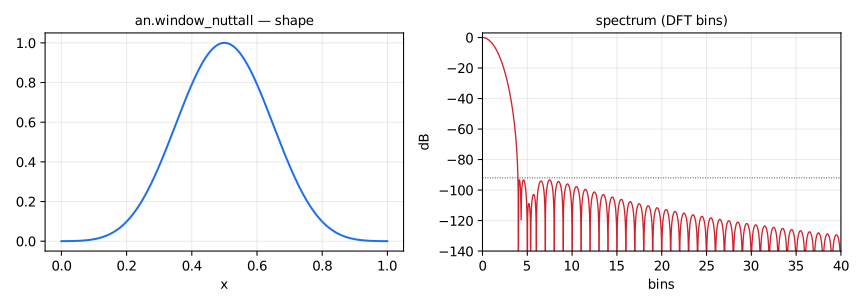
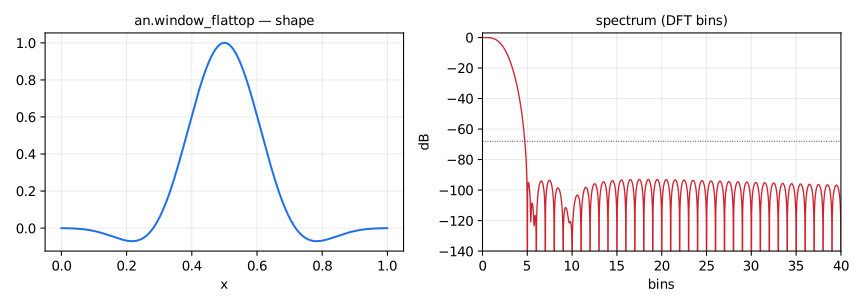
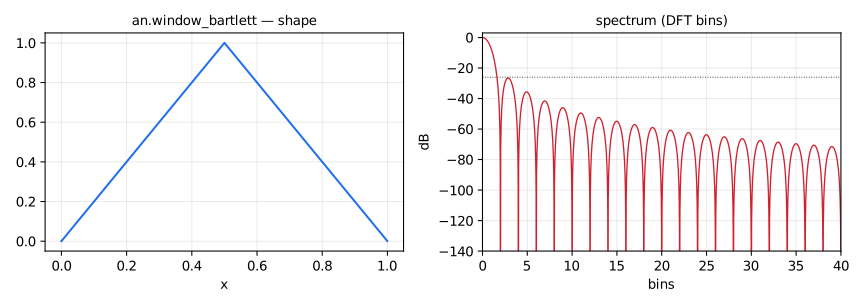
The classic fixed window functions:
window_rect: rectangular (boxcar) window, 1 inside [0,1], 0 outsidewindow_hann: Hann (raised cosine), -31.5 dB first sidelobewindow_hamming: Hamming (0.54/0.46), -42.7 dB first sidelobewindow_blackman: classic Blackman (3-term, 0.42/0.50/0.08), -58 dB (not Harris's "exact Blackman", 7938/9240/1430 over 18608)window_blackman_harris: minimum 4-term Blackman-Harris, -92 dBwindow_nuttall: Nuttall's continuous-first-derivative 4-term, -93 dBwindow_flattop: 5-term flat-top (amplitude-accurate spectral peaks, scalloping loss < 0.01 dB, very wide main lobe)window_bartlett: Bartlett (triangular, reaching 0 at both ends)
Usage
window_rect(x) : _
window_hann(x) : _
window_hamming(x) : _
window_blackman(x) : _
window_blackman_harris(x) : _
window_nuttall(x) : _
window_flattop(x) : _
window_bartlett(x) : _
Where:
x: normalized abscissa, the window support being [0,1] (values outside [0,1] return 0)
Test
an = library("analyzers.lib");
os = library("oscillators.lib");
window_hann_test = an.window_hann(os.lf_sawpos(100));
window_rect_test = an.window_rect(os.lf_sawpos(100));
window_hamming_test = an.window_hamming(os.lf_sawpos(100));
window_blackman_test = an.window_blackman(os.lf_sawpos(100));
window_blackman_harris_test = an.window_blackman_harris(os.lf_sawpos(100));
window_nuttall_test = an.window_nuttall(os.lf_sawpos(100));
window_flattop_test = an.window_flattop(os.lf_sawpos(100));
window_bartlett_test = an.window_bartlett(os.lf_sawpos(100));
References
- F.J. Harris, "On the use of windows for harmonic analysis with the discrete Fourier transform", Proc. IEEE 66(1), 1978.
- A.H. Nuttall, "Some windows with very good sidelobe behavior", IEEE Trans. ASSP 29(1), 1981.
- https://en.wikipedia.org/wiki/Window_function
(an.)window_cosN
Generic sum-of-cosines window: given the coefficient list (a0, a1, ..., aK),
evaluates a0 + a1*cos(2*PI*x) + a2*cos(4*PI*x) + ... inside [0,1] and 0
outside. All the fixed windows above are instances of this function; use it
directly for custom sidelobe trade-offs.
Usage
window_cosN(coeffs, x) : _
Where:
coeffs: the list(a0, a1, ..., aK)of cosine-series coefficients, alternating in sign for the usual windows (peak value at x = 1/2 is a0 - a1 + a2 - ...)x: normalized abscissa in [0,1]
Example
window_cosN((0.42, -0.50, 0.08), x) : _ // the Blackman window
Test
an = library("analyzers.lib");
os = library("oscillators.lib");
window_cosN_test = an.window_cosN((0.5, -0.5), os.lf_sawpos(100));
(an.)window_tukey
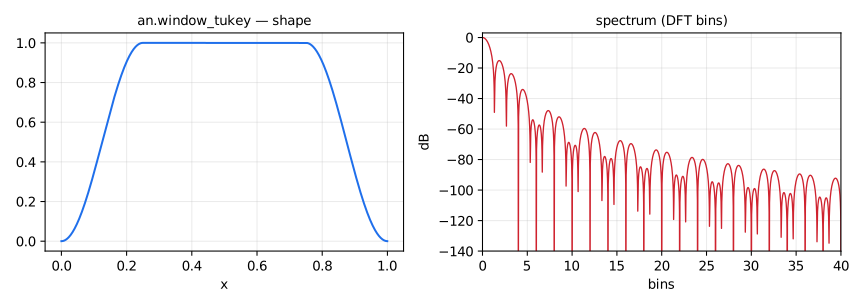
Tukey (cosine-tapered) window: flat at 1 over the central 1-a fraction of
the support, with raised-cosine tapers of total length a at the edges.
window_tukey(0) degenerates to the rectangular window and
window_tukey(1) to the Hann window.
Usage
window_tukey(a, x) : _
Where:
a: taper fraction between 0 and 1x: normalized abscissa in [0,1]
Test
an = library("analyzers.lib");
os = library("oscillators.lib");
window_tukey_test = an.window_tukey(0.5, os.lf_sawpos(100));
window_tukey_rect_test = an.window_tukey(0, os.lf_sawpos(100));
(an.)window_kaiser
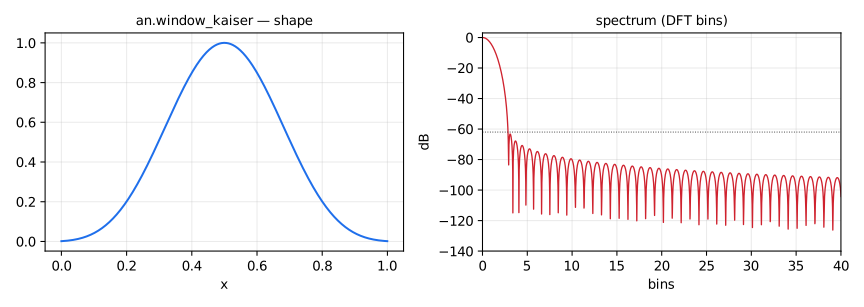
Kaiser window of shape parameter beta, computed with a fixed-length
series for the modified Bessel function I0 (40 terms: exact to double
precision for any useful beta, and pure arithmetic, so usable at compile
time). Larger beta trades main-lobe width for sidelobe attenuation:
beta = 0 is rectangular, 5 approximates Hamming, 8.6 approximates
Blackman.
Usage
window_kaiser(beta, x) : _
Where:
beta: shape parameter (>= 0), typically between 2 and 16x: normalized abscissa in [0,1]
Test
an = library("analyzers.lib");
os = library("oscillators.lib");
window_kaiser_test = an.window_kaiser(8.6, os.lf_sawpos(100));
References
- J.F. Kaiser and R.W. Schafer, "On the use of the I0-sinh window for spectrum analysis", IEEE Trans. ASSP 28(1), 1980.
FFT Subsystem
Sliding FFT/IFFT for complex and real signals, with the conversion and display helpers they rely on.
Complex vector representation. Throughout this section, a complex vector
signal of length N is a bank of 2*N parallel real signals holding
interleaved (real, imaginary) pairs: (r0,i0), (r1,i1), ..., (rN-1,iN-1).
This is the convention enforced by si.cbus(N), and it is the input and
output format of an.fft and an.ifft. A real vector signal of length N
is simply N parallel real signals (si.bus(N)). The rtorv/rtocv/rvtocv
functions convert a scalar signal or a real vector into these formats, and the
c_* functions operate on complex vectors.
(an.)c_magsq
Squared magnitude of each bin of a complex vector signal.
Usage
si.cbus(N) : c_magsq(N) : si.bus(N)
Where:
N: number of complex bins (power of 2 in FFT contexts)- input:
Ncomplex signals as interleaved (real, imaginary) pairs - output:
Nreal signals, thek-th one beingr(k)^2 + i(k)^2
(an.)c_magdb
Magnitude in dB (power) of each bin of a complex vector signal:
10*log10(r^2 + i^2), floored at ma.EPSILON to avoid log10(0).
Usage
si.cbus(N) : c_magdb(N) : si.bus(N)
Where:
N: number of complex bins- input:
Ncomplex signals as interleaved (real, imaginary) pairs - output:
Nreal signals giving the power of each bin in dB
(an.)c_select_pos_freqs
Select the N/2+1 non-negative-frequency bins (dc up to and including
Nyquist) out of an N-bin complex spectrum, discarding the redundant
negative-frequency bins of a real signal's spectrum.
select_pos_freqs(N) is the same selection for a real vector
(e.g. a power spectrum).
Usage
si.cbus(N) : c_select_pos_freqs(N) : si.cbus(N/2+1)
si.bus(N) : select_pos_freqs(N) : si.bus(N/2+1)
Where:
N: full spectrum size (power of 2)- output: bins
0..N/2(dc and Nyquist included)
(an.)rtorv, (an.)rtocv, (an.)rvtocv
Convert a real signal to the vector formats used by an.fft:
rtorv(N,x): real scalar signal to length-Nreal vector holding the lastNsamples ofx, newest first:(x, x@1, ..., x@(N-1))rtocv(N,x): real scalar signal to length-Ncomplex vector holding the lastNsamples ofx, newest first, with zero imaginary parts:(x,0), (x@1,0), ..., (x@(N-1),0)rvtocv(N): length-Nreal vector to length-Ncomplex vector with zero imaginary parts
Because the newest sample comes first, rtocv(N) : an.fft(N) is the DFT of the
time-reversed window, V(k,n) = sum(i=0..N-1) x(n-i) exp(-j*2*pi*k*i/N), and
for a real x it equals exp(j*2*pi*k/N) * conj(X(k,n)), where
X(k,n) = sum(m=0..N-1) x(n-N+1+m) exp(-j*2*pi*k*m/N) is the standard sliding
DFT (numpy.fft.fft(x[n-N+1:n+1])). Magnitudes are those of X(k,n); phases
are conjugated and offset by 2*pi*k/N, so a sinusoid's phase turns backwards.
For the chronological (oldest-first) order and the standard sliding DFT, use
an.rtorv_chrono and an.rtocv_chrono.
Usage
rtorv(N,x) : si.bus(N)
rtocv(N,x) : si.cbus(N)
si.bus(N) : rvtocv(N) : si.cbus(N)
Where:
N: vector size (power of 2 in FFT contexts, known at compile time)x: a real (scalar) input signal
Test
an = library("analyzers.lib");
os = library("oscillators.lib");
no = library("noises.lib");
rtocv_test = an.rtocv(8, os.tosc(220));
rtorv_test = an.rtorv(4, no.noise);
(an.)rtorv_chrono
Real scalar signal to length-N real vector holding the last N samples of
x in chronological order, oldest first: (x@(N-1), ..., x@1, x).
Element m is x(n-N+1+m) at time n, the order a DFT expects.
an.rtorv holds the same samples newest first.
Usage
rtorv_chrono(N,x) : si.bus(N)
Where:
N: vector size (power of 2 in FFT contexts, known at compile time)x: a real (scalar) input signal
Test
an = library("analyzers.lib");
no = library("noises.lib");
rtorv_chrono_test = an.rtorv_chrono(4, no.noise);
(an.)rtocv_chrono
Real scalar signal to length-N complex vector holding the last N samples
of x in chronological order, oldest first, with zero imaginary parts:
(x@(N-1),0), ..., (x@1,0), (x,0).
rtocv_chrono(N) : an.fft(N) is the standard sliding DFT
X(k,n) = sum(m=0..N-1) x(n-N+1+m) exp(-j*2*pi*k*m/N), i.e.,
numpy.fft.fft(x[n-N+1:n+1]), its phase referred to the oldest sample of the
window, and rtocv_chrono(N) : an.fft(N) : an.ifft(N) returns the window,
oldest first (the test keeps its real parts: the imaginary parts are rounding
noise). an.rtocv holds the same samples newest first.
Usage
rtocv_chrono(N,x) : si.cbus(N)
Where:
N: vector size (power of 2 in FFT contexts, known at compile time)x: a real (scalar) input signal
Test
an = library("analyzers.lib");
no = library("noises.lib");
rtocv_chrono_test = an.rtocv_chrono(8, no.noise);
rtocv_chrono_ifft_test = an.rtocv_chrono(8, no.noise) : an.fft(8) : an.ifft(8) : par(i, 8, (_, !));
(an.)bit_reverse_shuffle, (an.)c_bit_reverse_shuffle, (an.)bit_reverse_selector
Bit-reversal permutation of a vector signal, as performed on the input of a
decimation-in-time radix-2 FFT. bit_reverse_shuffle(N) permutes a real
vector, c_bit_reverse_shuffle(N) a complex vector. Used internally by
an.fft and an.ifft. bit_reverse_selector(N,i) is the constant index
(in 0..N-1) of the channel that the permutation sends to channel i:
i with its log2(N) bits reversed, e.g. bit_reverse_selector(8,1) is 4.
Usage
si.bus(N) : bit_reverse_shuffle(N) : si.bus(N)
si.cbus(N) : c_bit_reverse_shuffle(N) : si.cbus(N)
bit_reverse_selector(N,i) : _
Where:
N: vector size (must be a power of 2)i: a channel index in 0..N-1, known at compile time
(an.)fft, (an.)fftb
Fast Fourier Transform (FFT).
fft(N) is a length-N FFT for complex signals (radix 2). Its input,
si.cbus(N), is a bus of N complex signals, each specified by real and
imaginary parts: (r0,i0), (r1,i1), (r2,i2), ... Its output is a bank of N
complex signals containing the complex spectrum over time: (R0, I0),
(R1,I1), ... The dc component is (R0,I0), where I0=0 for real input signals.
fftb(N) is the butterfly core of fft(N): same buses, but it expects its
input already in bit-reversed order (see the implementation notes).
Usage
si.cbus(N) : fft(N) : si.cbus(N)
si.cbus(N) : fftb(N) : si.cbus(N)
Where:
N: FFT size (must be a power of 2: 2,4,8,16,... known at compile time)
FFTs of Real Signals:
- To perform a sliding FFT over a real input signal, you can say
process = signal : an.rtocv(N) : an.fft(N);
where an.rtocv converts a real (scalar) signal to a complex vector signal having a zero imaginary part.
an.rtocv puts the newest sample first, so this is the DFT of the time-reversed window:
for real input it equals exp(j*2*pi*k/N) * conj(X(k,n)), where X(k,n) is the standard
sliding DFT (same magnitudes; see an.rtocv).
-
For the standard sliding DFT
X(k,n) = sum(m=0..N-1) x(n-N+1+m) exp(-j*2*pi*k*m/N), i.e.,numpy.fft.fft(x[n-N+1:n+1]), sayprocess = signal : an.rtocv_chrono(N) : an.fft(N); -
See
an.rfft_analyzer_c(inanalyzers.lib) and related functions for more detailed usage examples. -
Use
an.rfft_spectral_level(N,tau,dB_offset)to display the power spectrum of a real signal. -
See
dm.fft_spectral_level_demo(N)indemos.libfor an example GUI drivingan.rfft_spectral_level().
Test
an = library("analyzers.lib");
os = library("oscillators.lib");
mono = os.tosc(220);
fft_test = an.rtocv(8, mono) : an.fft(8);
References
Implementation notes
fft(N) is c_bit_reverse_shuffle(N) followed by fftb(N), the radix-2
butterfly core, which expects its input already in bit-reversed order.
(an.)ifft, (an.)ifftb
Inverse Fast Fourier Transform (IFFT).
ifftb(N) is the butterfly core of ifft(N): same buses, but it expects
its input already in bit-reversed order (see the implementation notes).
Usage
si.cbus(N) : ifft(N) : si.cbus(N)
si.cbus(N) : ifftb(N) : si.cbus(N)
Where:
N: IFFT size (power of 2)- Input is a complex spectrum represented as interleaved real and imaginary parts: (R0, I0), (R1,I1), (R2,I2), ...
- Output is a bank of N complex signals giving the complex signal in the time domain: (r0, i0), (r1,i1), (r2,i2), ...
an.fft(N) : an.ifft(N)is the identity, so the round trip keeps the order of the window: newest sample first afteran.rtocv(N,x), oldest first afteran.rtocv_chrono(N,x).
Test
an = library("analyzers.lib");
os = library("oscillators.lib");
mono = os.tosc(220);
ifft_test = (an.rtocv(8, mono) : an.fft(8)) : an.ifft(8);
Implementation notes
ifft(N) is c_bit_reverse_shuffle(N) followed by ifftb(N), the
conjugate butterfly core (which also applies the 1/N scaling), so that
an.fft(N) : an.ifft(N) is the identity.
(an.)rfft_analyzer_c, (an.)rfft_analyzer_db, (an.)rfft_analyzer_magsq
Sliding FFT analyzers for a real input signal, built from an.fft:
rfft_analyzer_c(N): complex spectrum, bins 0 to N/2 (dc to Nyquist)rfft_analyzer_db(N): power of each bin in dBrfft_analyzer_magsq(N): squared magnitude of each bin
"Sliding" means the N-point FFT is recomputed every sample over the last
N input samples, with no windowing (rectangular window) and no hop.
The window is built by an.rtocv, newest sample first, so rfft_analyzer_c(N)
returns the DFT of the time-reversed window: for bin k at time n,
exp(j*2*pi*k/N) * conj(X(k,n)), where
X(k,n) = sum(m=0..N-1) x(n-N+1+m) exp(-j*2*pi*k*m/N) is the standard sliding
DFT. Its magnitudes are those of X(k,n), so rfft_analyzer_db and
rfft_analyzer_magsq give the sliding-DFT power spectrum; its phases are
conjugated and offset. an.rfft_analyzer_c_chrono returns X(k,n) itself.
Usage
_ : rfft_analyzer_c(N) : si.cbus(N/2+1)
_ : rfft_analyzer_db(N) : si.bus(N/2+1)
_ : rfft_analyzer_magsq(N) : si.bus(N/2+1)
Where:
N: FFT size (must be a power of 2 known at compile time)- input: a real (scalar) signal
- output: the
N/2+1non-negative-frequency bins, complex forrfft_analyzer_c(interleaved real/imaginary pairs), real for the others
Test
an = library("analyzers.lib");
ba = library("basics.lib");
no = library("noises.lib");
rfft_analyzer_db_test = 2 * ba.pulse(8) + 0.5 * ba.pulse(4) : an.rfft_analyzer_db(8); // bins of 3 and 2: 9.54 and 6.02 dB
rfft_analyzer_c_test = no.noise : an.rfft_analyzer_c(8);
rfft_analyzer_magsq_test = no.noise : an.rfft_analyzer_magsq(8);
(an.)rfft_analyzer_c_chrono
Standard sliding DFT of a real signal, bins 0 to N/2 (dc to Nyquist):
X(k,n) = sum(m=0..N-1) x(n-N+1+m) exp(-j*2*pi*k*m/N), i.e.,
numpy.fft.fft(x[n-N+1:n+1])[0:N/2+1], recomputed every sample over the last
N samples (rectangular window, no hop). The phase is referred to the oldest
sample of the window: a sinusoid at the bin frequency 2*pi*k/N advances it
by 2*pi*k/N per sample. Built from an.rtocv_chrono, it is the chronological
counterpart of an.rfft_analyzer_c, which returns
exp(j*2*pi*k/N) * conj(X(k,n)); the magnitudes of the two are the same.
Usage
_ : rfft_analyzer_c_chrono(N) : si.cbus(N/2+1)
Where:
N: FFT size (must be a power of 2 known at compile time)- input: a real (scalar) signal
- output: the
N/2+1non-negative-frequency bins as interleaved (real, imaginary) pairs
Test
an = library("analyzers.lib");
no = library("noises.lib");
rfft_analyzer_c_chrono_test = no.noise : an.rfft_analyzer_c_chrono(8);
(an.)rfft_spectral_level
Real-signal FFT power spectrum display: passes the signal through unchanged
and shows the smoothed level of each of the N/2+1 non-negative-frequency
bins in a bank of dB bargraphs.
Usage
_ : rfft_spectral_level(N,tau,dB_offset) : _
Where:
N: FFT size (must be a power of 2 known at compile time)tau: display averaging-time (time constant) in secondsdB_offset: constant dB offset applied to all band level meters
See dm.fft_spectral_level_demo(N) in demos.lib for an example GUI.
Spectral Descriptors (filter-bank based)
Low-level MIR descriptors computed on the constant-Q filter banks of this library rather than on an FFT: monorate, sample-accurate, no framing. The M-per-octave analyzer splits the signal into N bands (highest band first, dc band last); the descriptors combine the smoothed band powers with the geometric band-center frequencies.
(an.)spectral_centroid, (an.)spectral_spread
Spectral centroid and spread of a signal, in Hz, computed from the band
powers of an.mth_octave_analyzer(O,M,ftop,N): the centroid is the
power-weighted mean of the band center frequencies, the spread the
power-weighted standard deviation around it. Frequency resolution is that
of the filter bank (M bands per octave).
Usage
_ : spectral_centroid(O,M,ftop,N,T) : _
_ : spectral_spread(O,M,ftop,N,T) : _
Where:
O: band-split filter order (a constant numerical expression)M: bands per octave (a constant numerical expression)ftop: highest band-split crossover frequency in HzN: total number of bands, including dc and top (a constant numerical expression)T: power averaging time in seconds
Test
an = library("analyzers.lib");
os = library("oscillators.lib");
spectral_centroid_test = os.tosc(1000) : an.spectral_centroid(3, 1, 8000, 6, 0.1);
spectral_spread_test = os.tosc(800) + os.tosc(5000) : an.spectral_spread(3, 1, 8000, 6, 0.1);
(an.)band_powers, (an.)band_center, (an.)moment, (an.)safe_div
The machinery shared by the descriptors: band_powers(O,M,ftop,N,T) is
the bank of smoothed band powers (highest band first, like the analyzer
itself), band_center(M,ftop,N,i) the geometric center frequency in Hz
of band i (top and dc bands use their edges), moment(M,ftop,N,K) sums
N band powers weighted by center^K, and safe_div divides with an
epsilon-guarded denominator.
Usage
_ : band_powers(O,M,ftop,N,T) : si.bus(N)
band_center(M,ftop,N,i) : _
si.bus(N) : moment(M,ftop,N,K) : _
safe_div(num, den) : _
Where:
O: band-split filter order (a constant numerical expression)M: bands per octave (a constant numerical expression)ftop: highest band-split crossover frequency in HzN: total number of bands, including dc and top (a constant numerical expression)T: power averaging time in secondsi: band index, from 0 (top band) to N-1 (dc band)K: exponent of the band center frequencies in the momentnum,den: numerator and denominator signals ofsafe_div
(an.)spectral_flux
Spectral flux: the half-wave-rectified increase of each band amplitude
over a hop-second interval, summed across the bands of
an.mth_octave_analyzer(O,M,ftop,N). Rises sharply on note onsets and
broadband transients; threshold it for a simple onset detector.
Usage
_ : spectral_flux(O,M,ftop,N,hop) : _
Where:
O,M,ftop,N: filter bank parameters as abovehop: comparison interval in seconds (also used as the amplitude smoothing time; 10-50 ms typical)
Test
an = library("analyzers.lib");
os = library("oscillators.lib");
ba = library("basics.lib");
spectral_flux_test = os.tosc(1000) * ((ba.time % 24000) > 12000) : an.spectral_flux(3, 1, 8000, 6, 0.02);
Loudness Metering (EBU R128 / ITU-R BS.1770)
Multichannel loudness measurement after Recommendation ITU-R BS.1770-4 /
EBU R128: each channel is prefiltered with the K-filter
(fi.itu_r_bs_1770_4_kfilter, normalized so that no -0.691 dB correction
is needed), mean-squared over the measurement window, channel-weighted
(1.0 for the first three channels, 1.41 for surround channels 4 and 5,
LFE not handled) and summed; loudness is 10*log10 of that sum, in LUFS.
(an.)loudness_momentary, (an.)loudness_shortterm
Momentary (400 ms window) and short-term (3 s window) loudness of an N-channel signal, in LUFS, per ITU-R BS.1770-4.
A 997 Hz full-scale sine reads -3.01 LUFS on one channel and 0.0 LUFS on two channels, matching the BS.1770 compliance points.
Usage
si.bus(N) : loudness_momentary(N) : _
si.bus(N) : loudness_shortterm(N) : _
Where:
N: number of channels, in BS.1770 order (L, R, C, Ls, Rs), a constant numerical expression
Test
an = library("analyzers.lib");
os = library("oscillators.lib");
loudness_momentary_test = os.tosc(997), os.tosc(997) : an.loudness_momentary(2);
loudness_shortterm_test = os.tosc(997), os.tosc(997) : an.loudness_shortterm(2);
References
- https://www.itu.int/rec/R-REC-BS.1770
- EBU R128 / EBU Tech 3341.
(an.)loudness_meansquare, (an.)meansquare2lufs
The machinery shared by the loudness meters: loudness_meansquare(T,N)
is the channel-weighted, K-filtered mean square of an N-channel signal
over a T-second rectangular window (the linear-domain quantity BS.1770
calls the sum of G_i z_i), and meansquare2lufs converts it to LUFS
(10*log10, floored at -100).
Usage
si.bus(N) : loudness_meansquare(T,N) : _
_ : meansquare2lufs : _
si.bus(N) : loudness_meansquare(T,N) : meansquare2lufs : _ // loudness in LUFS
Where:
T: averaging window in secondsN: number of channels, in BS.1770 order, a constant numerical expression
(an.)loudness_integrated
Streaming approximation of the gated integrated (programme) loudness of EBU R128, in LUFS: the 400 ms mean square is accumulated under the -70 LUFS absolute gate, a relative threshold is derived 10 LU below the absolute-gated running mean, and a second accumulation under that threshold yields the integrated value.
This is the usual real-time meter construction: it differs from the offline two-pass measurement in that already-accumulated blocks are not re-gated when the relative threshold later moves, and gating is applied per sample rather than on 75%-overlapped 400 ms blocks. On programme material the deviation is typically well under 0.5 LU.
The measurement starts at power-up and never resets; restart the DSP to restart the measurement.
Usage
si.bus(N) : loudness_integrated(N) : _
Where:
N: number of channels, in BS.1770 order, a constant numerical expression
Test
an = library("analyzers.lib");
os = library("oscillators.lib");
loudness_integrated_test = os.tosc(997), os.tosc(997) : an.loudness_integrated(2);
References
- https://www.itu.int/rec/R-REC-BS.1770 (gating: BS.1770-4, section 2)
- EBU Tech 3341, "Loudness Metering: 'EBU Mode' metering".
(an.)true_peak
True-peak estimate per ITU-R BS.1770-4 Annex 2: the signal is 4x
oversampled with a 48-tap polyphase windowed-sinc interpolator (12 taps
per phase, Kaiser window beta = 10, each phase normalized to unity DC
gain, all weights computed at compile time with an.window_kaiser), and
the output is the largest absolute value among the four inter-sample
phases. Feed it to a max-hold for a dBTP meter reading:
an.true_peak : max ~ _ : ba.linear2db.
Usage
_ : true_peak : _
Test
an = library("analyzers.lib");
os = library("oscillators.lib");
true_peak_test = os.tosc(12000)*0.97 : an.true_peak;
References
- https://www.itu.int/rec/R-REC-BS.1770 (Annex 2)
Test signal generators
Signal generators for testing purposes.
(an.)logsweep
Logarithmic sine sweep generator.
Usage
logsweep(fs,fe,dur) : _
Where:
fs: start frequency in Hzfe: end frequency in Hzdur: duration of the sweep in seconds
Test
an = library("analyzers.lib");
logsweep_test = an.logsweep(20, 2000, 5);
(an.)linsweep
Linear sine sweep generator.
Usage
linsweep(fs,fe,dur) : _
Where:
fs: start frequency in Hzfe: end frequency in Hzdur: duration of the sweep in seconds
Test
an = library("analyzers.lib");
linsweep_test = an.linsweep(20, 2000, 5);